|
|
| |

Chart Gallery
To access the "Explore" exercises for each chart, click on "O" for the on-line version, "P" for the print version, and "P/A" for the print version with answers.
| Population Growth Rate Chart Gallery | ||
|
Chart 1. Total World Population by Country Income Group, 1980, 1998, 2015 
O P P/A |
Chart 2. Average Annual Growth Rates by Country Income Group, 1980-2015 
O P P/A |
Chart 3. Composition of Population in Low- and High-income Economies, 2000/2030 
O P P/A |
| Life Expectancy Chart Gallery | ||
|
Chart 1. Life Expectancy at Birth, 1980 and 1998 
O P P/A |
Chart 2. Infant Mortality Rate, 1980 and 1998 (deaths per 1,000 live births) 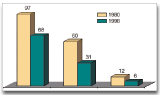
O P P/A |
Chart 3. Child Mortality Rate for Boys and Girls, 1988-1998 
O P P/A |
| GNP per Capita Chart Gallery | ||
|
Chart 1. GNP, Population, and GNP per Capita, 2000 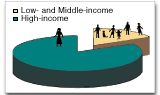
O P P/A |
Chart 2. Growth of GNP, Population, and GNP per Capita, 19801998 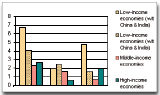
O P P/A |
Chart 3. Income Distribution in Three Countries for Percentage of Households 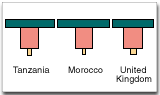
O P P/A |
| Access to Safe Water Chart Gallery | ||
|
Chart 1. World Population and Access to Safe Water, 1990-96 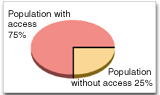
O P P/A |
Chart 2. Life Expectancy and Improvements in Water Supply and Sanitation in Three French Cities, 1820-1900 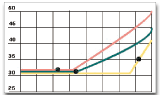
O P P/A |
Chart 3. Sources of Water in Maputo, Mozambique, 1996 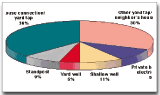
O P P/A |
Home | Site Guide | Modules | What's SD? | SD Post | Resources | About DEP
| Copyright
© 2000 IBRD/The World Bank |
dep@worldbank.org |